Real-time Spectrum Display
 |
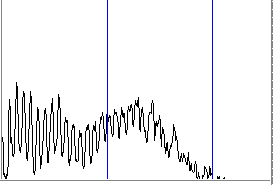
The spectrum is a single slice of the spectrogram showing the energy in the voice sound at different frequencies.
In this display, the frequencies are arranged horizontally
The frequency axis extends from 0 on the left to 5kHz on the right. Vertical lines indicate 2kHz and 4kHz.
The higher the peak, the more energy at that particular frequency.
Some smoothing is provided on the spectrum so that when a sound suddenly stops, the displayed spectrum takes about a second to slowly decay down. In other words, the displayed spectrum is the energy in the voice over about a second.
By changing the view (in the Options menu) to the Longterm-Average Spectrum (LTAS) the smoothing time is increased to several minutes, so that the displayed spectrum shows the average energy in the voice over the long term. This may indicate characteristics of the vocal source - in other words, the unchanging character of the voice after averaging out the changing pitch and vowel resonances.