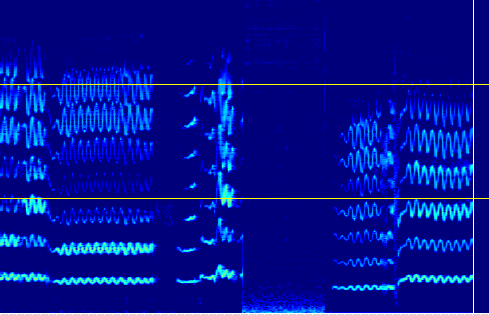
Voice Spectrogram Display
The spectrogram shows a scrolling image of how the power in the voice is spread between all the frequencies, from low frequencies at the bottom to high frequencies at the top of the display. Time goes from left to right on the display, so that an image of how the voice looks while you are singing gradually appears on the display.

|
|
The yellow vertical line indicates time as it happens. When it reaches the right end of the display, it scrolls right around to the left edge and starts moving across the display again.
The frequency range of the display is from 0 (at the bottom) to 5kHz (5000 cycles per second) at the top.
The horizontal lines drawn on the display show 2kHz and 4kHz.
The default spectrogram shows a Narrowband spectrogram, where the individual harmonics of the voice sound are resolved. By switching to the Broadband spectrogram option a different perspective on the voice is shown.
The brightness of the image represents how much energy appears at that frequency and at that instant in time in the voice sound.
You can change the colours used by means of the options in the Options Menu.